

Deployment Confidence in Era of AI Coding
Significant reliability improvements through in-house canary
Written by Steponas Dauginis and Sean Chen
We see more code being written by GenAI over time. Due to careful human inspection, we aren’t yet seeing a regression in the quality of code (link). But if trends continue, companies will want solid and lighterweight mechanisms in place to prevent bad code from shipping to customers. Robust canarying is one such mechanism.
In a canary deployment, new software is rolled out to a subset of traffic before wider distribution. If problems are detected, the software can be rolled back without impacting everyone.
At CloudKitchens, over 80% of all our service releases are conducted via canary, and over 95% of releases for services in the critical path (order fulfillment) leverage canary. In Q3 2025, canary blocked more than 1100 bad releases across the company, many of which could have resulted in user-facing regressions, if not downright outages.
If you search for blog articles on this topic, you will find writeups describing an idealized version of it. Many of these posts are penned by companies advertising their canary solution, often as part of a broader CI/CD offering.
Here we describe how canary adoption and usage evolved in practice at our company, including early missteps and later improvements.
We are not trying to sell you anything; instead, we will share insights into the essential properties of a canary system that you will want, regardless of whether you buy a solution or build your own (as we did!).
High-Stakes Deployments
At CloudKitchens, processing real-time food orders is at the heart of our business.
In the beginning, all order fulfillment ran in a single region on our cloud provider. When we deployed a new version of our service, the new software quickly handled 100% of customer traffic. If a bug was introduced, engineers would be paged to manually identify the faulty deployment and then roll it back – a process that could last over an hour. In fact, well over 75% of our outages were triggered by bad deployments. To make matters worse, not all problematic changes were even caught by our alerts in the first place.
To make ourselves resilient to datacenter outages, we began operating critical applications and supporting infrastructure across three separate regions. Conveniently, our deployment tools added a 60-minute delay between regional deployments. This delay allowed engineers to halt the deployment if issues were detected in the first region, effectively making it a deployment where the canary population was a whopping 33% of traffic (if problems were detected in time). Still, many bad deployments slipped through undetected until they reached region #3.
Canary Basics
In summary, we faced two closely related challenges:
Knowing if something is broken.
Rolling back a deployment once there is enough signal that it is causing the breakage.
Knowing Something Is Wrong
Even before we can make decisions at deployment time about whether a new software version is healthy to roll out fully, we need to answer: “how do we know something is broken?”.
When engineers are required to manually create their own dashboards and alerts, this not only requires an excessive amount of their time, but it also leads to inconsistent monitoring across the company.
Therefore, even before we invested in deployment automation, we built observability automation that:
Periodically scans our Kubernetes clusters to discover running services.
Associates each running service with Prometheus metrics that match labels derived from the service’s unique identifier.
Generates dashboard panels and alert specifications from the discovered metrics and pushes them to Grafana.
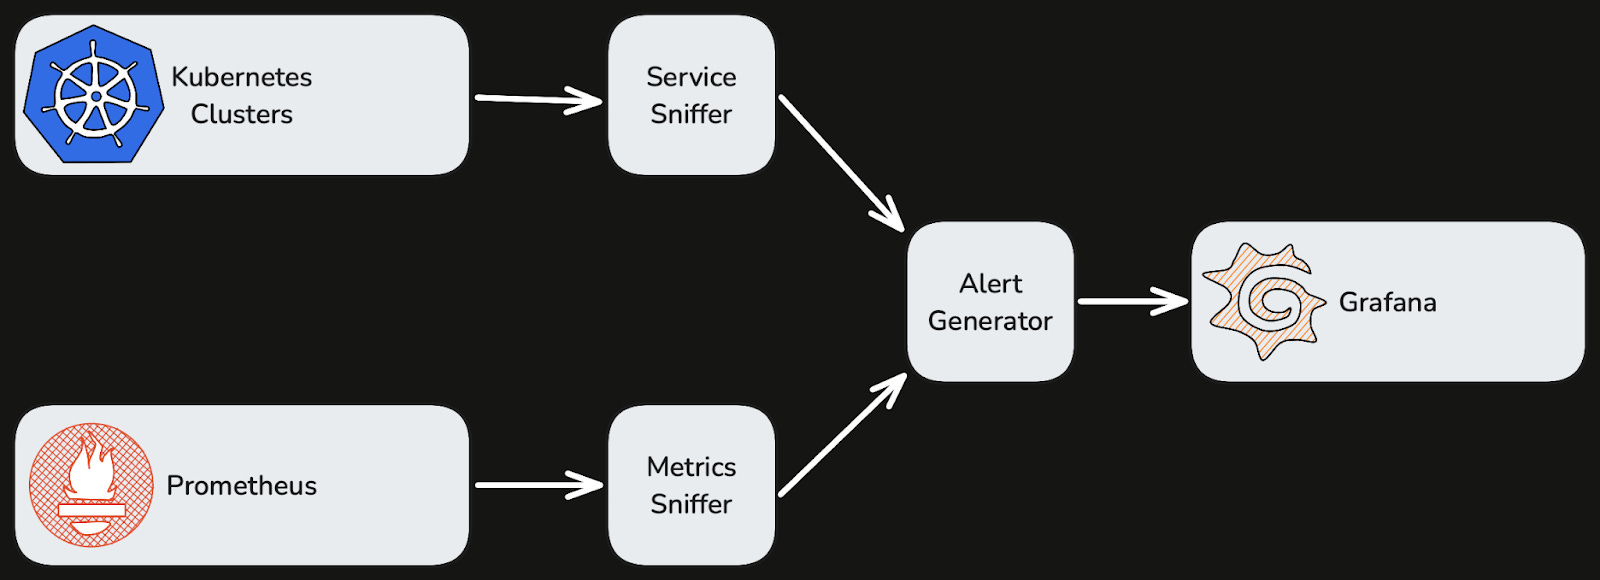
An over-simplified data flow
The importance of standardizing on middleware and client libraries that emit consistent metrics cannot be overstated. As a concrete example, a Java service that serves inbound GRPC traffic, reads from CockroachDB, and writes to Kafka would receive a tailored dashboard soon after its initial deployment.
Some of its critical alerts would cover:
Container health: CPU request utilization, container memory limits, excessive container restarts. We leveraged kube-state-metrics.
Application runtime health: JVM heap utilization, threadpool queue size, and GC pauses.
RPCs: The availability and latency of each exposed GRPC endpoint. Users can also enable alerts on egress failures if appropriate.
Database client performance: SQL statement success rate and latency.
Kafka client performance: Enqueue success rate and latency.
Excessive volume of error-severity logs.
. . .
This automation meant that when an engineer deployed a service, they automatically received a standardized dashboard featuring highly relevant alerts – with no upfront payment on manual configuration. Updating a service – for example, adding a new RPC – would automatically result in new panels and alerts, requiring no continual maintenance either.
Rolling Forward Or Rolling Back
Having the required metrics in-place for each service, we can now stand up a rudimentary canary mechanism as follows.
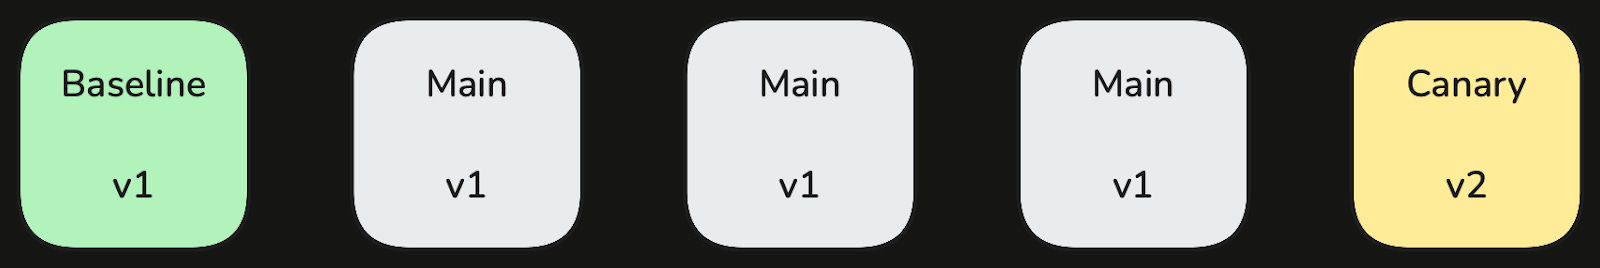
For each service, we separate its instances into three groups: baseline, canary, and main. We then manipulate these groups during the following phases of our deployment:
Pre-Deploy: Only the main partition has running instances – this is steady-state behavior.

Create New Groups: We spin up additional canary instances running the new code and additional baseline instances running the previous code. The instances in these groups handle live traffic as soon as they are created. If there are 3 main instances at steady state, and we add 1 baseline instance and 1 canary instance during the deployment, then we are rolling out new software to 20% of traffic, assuming a round-robin load-balancing policy for our services.
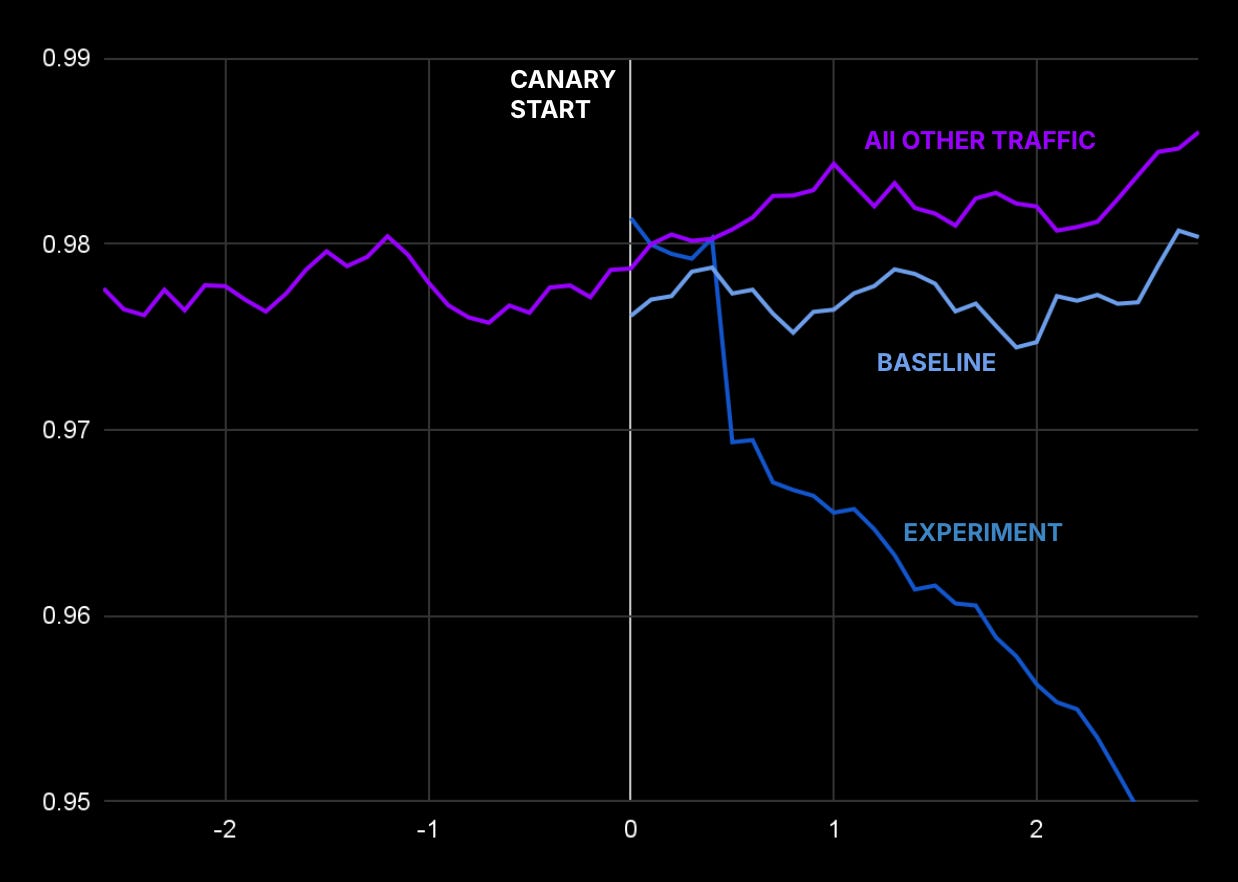
Analyze Metrics: We compare the behavior of the baseline and canary partitions by checking the metrics we already configured for this service, pitting the matching metric from each partition against one another. As its name suggests, we use the baseline partition as the basis for comparison (rather than the main partition) so that we can monitor startup issues – such as unusual memory utilization or caching patterns.
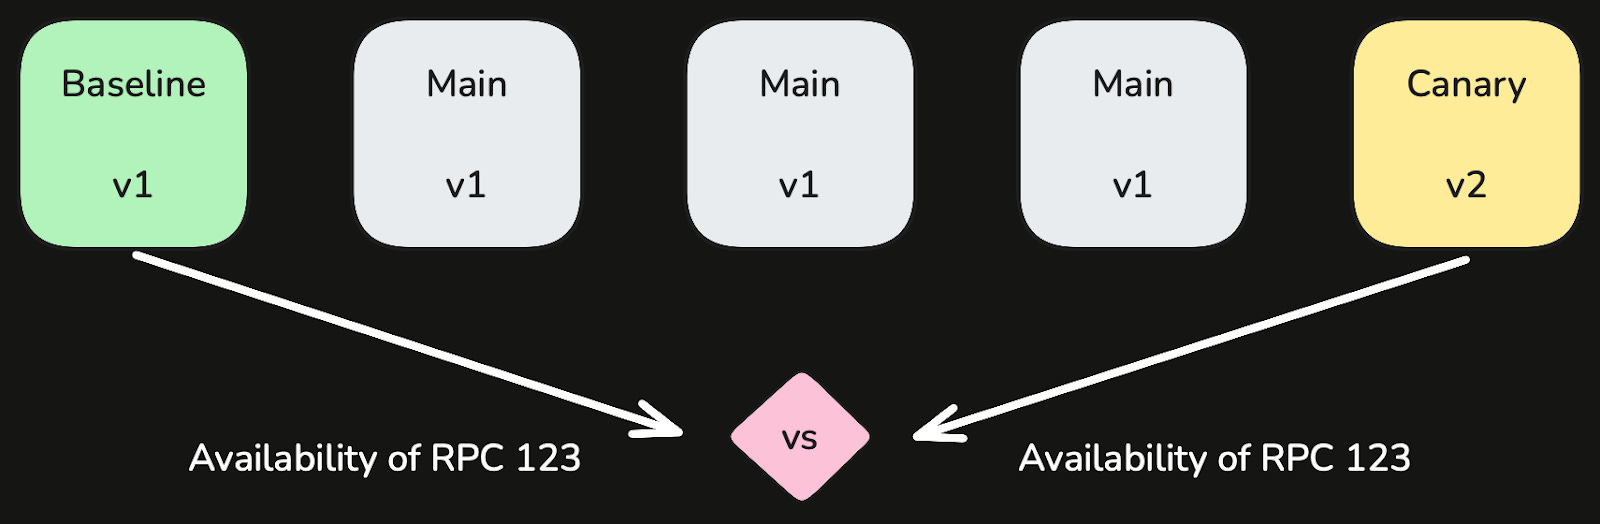
Make The Call: The system decides whether to roll forward (promote all main partition instances to the new version) or roll back based on failing checks. Roll forward decisions wait for a longer analysis window. But we roll back more quickly at the onset of a failing check.
Roll forward to:

or roll back to:

We use the Mann-Whitney U test to determine whether metric fluctuations are significant or simply random noise. While we considered t-test and distance functions, this method produced the fewest false positives in our evaluation dataset.
💡 Takeaway: To bootstrap our canary deployment mechanism, we leveraged the same metrics that engineers already relied on to monitor their services in steady-state conditions.
Initial Results
This first pass was effective at catching the most glaring issues – the two most frequent classes of issue were degraded availability or latency for a modified RPC; and crashes / out-of-memory errors.
Though still primitive, adopting this approach for critical services across the company prevented several dozen production bugs each month. However, numerous gaps remained.
Towards Maturity
Below are the shortcomings of our original solution, and how we addressed each of them over a span of several months (and thousands of deployments). Comparing our Q3 stats against Q2, these changes enabled us to catch 82% more bad releases, while the total number of canary releases increased by only 28%.
Granularity
Consider the prior example, where a service is running on 18 instances at steady state. To achieve the smallest possible rollout, where we add 1 baseline instance and 1 canary instance during the deployment, our smallest rollout is 5%. But at our scale, this is still higher than desired, exposing more customers to new code. For example, if we process 1000 orders per minute, a bad deployment could affect up to 50 x 3 = 150 customers even if we could roll back within 3 minutes (though, we can lessen its impact via aggressive retries). Regardless, that’s far too many unhappy customers.
Even more problematic were critical services requiring very few instances. For a service running only 2 instances, the smallest rollout amounted to 25% (1 out of 4). That is not much better than the 33% from our makeshift canary that waits between regions.
To address this, we integrated our canary mechanism with our load-balancing solution. Using Istio as our service mesh, we adapted our process to create three sets of VirtualService resources (for main, baseline, and canary) to drive proportional traffic, adjusting weights gradually as we progress through the deployment.
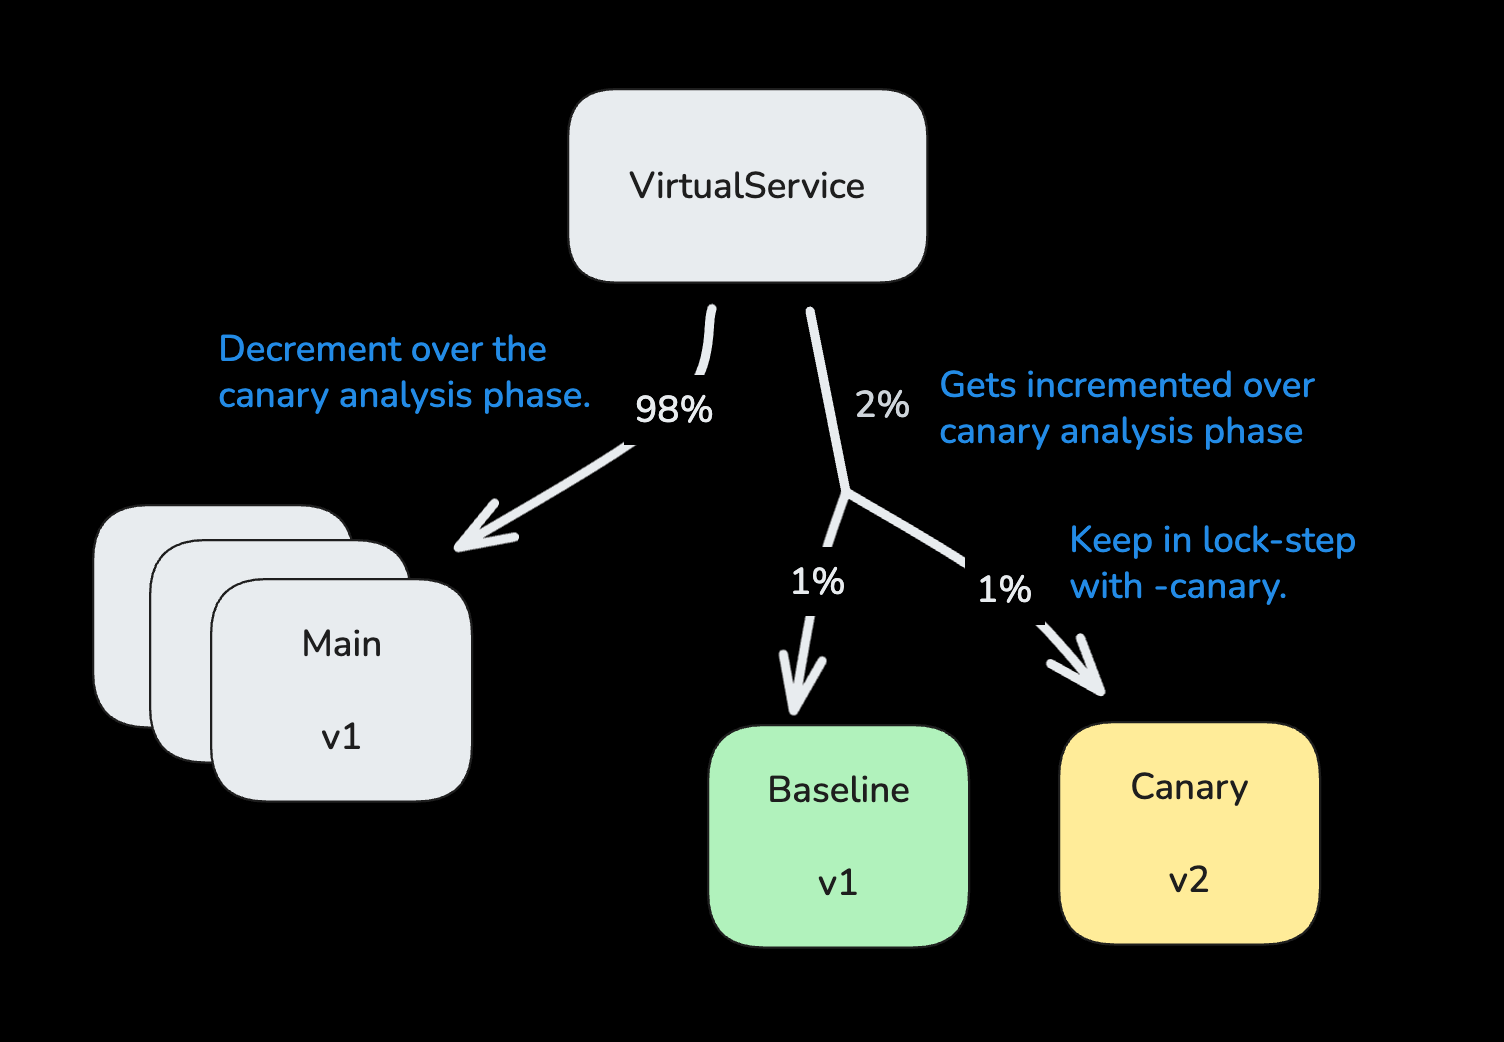
This decouples our canary rollout granularity from the service’s horizontal scaling.
💡 Takeaway: Canary deployments must be fully integrated with the chosen load balancing solution in order to finely tune the rollout process, reducing the blast radius of potential failures.
Canarying for Indirect Failures
While guarding each service’s deployment with its own emitted metrics prevents many common issues, it doesn’t capture the whole picture.
Take for example, a bug where an important endpoint is deleted inadvertently. The canary mechanism would not have matching sets of metrics to compare endpoint performance between baseline and canary partitions; and furthermore, it cannot possibly know if the deletion was intentional or not (e.g. part of a planned migration). In practice, we have also seen outages where a backward-incompatible schema change is made, and canary instances actually exhibit lower error rates because only they can process the new schema definitions.
To address such end-to-end issues, we canary on traces across all our most important services. By tracking availability, latency, and throughput for these traces, we can monitor overall business health.
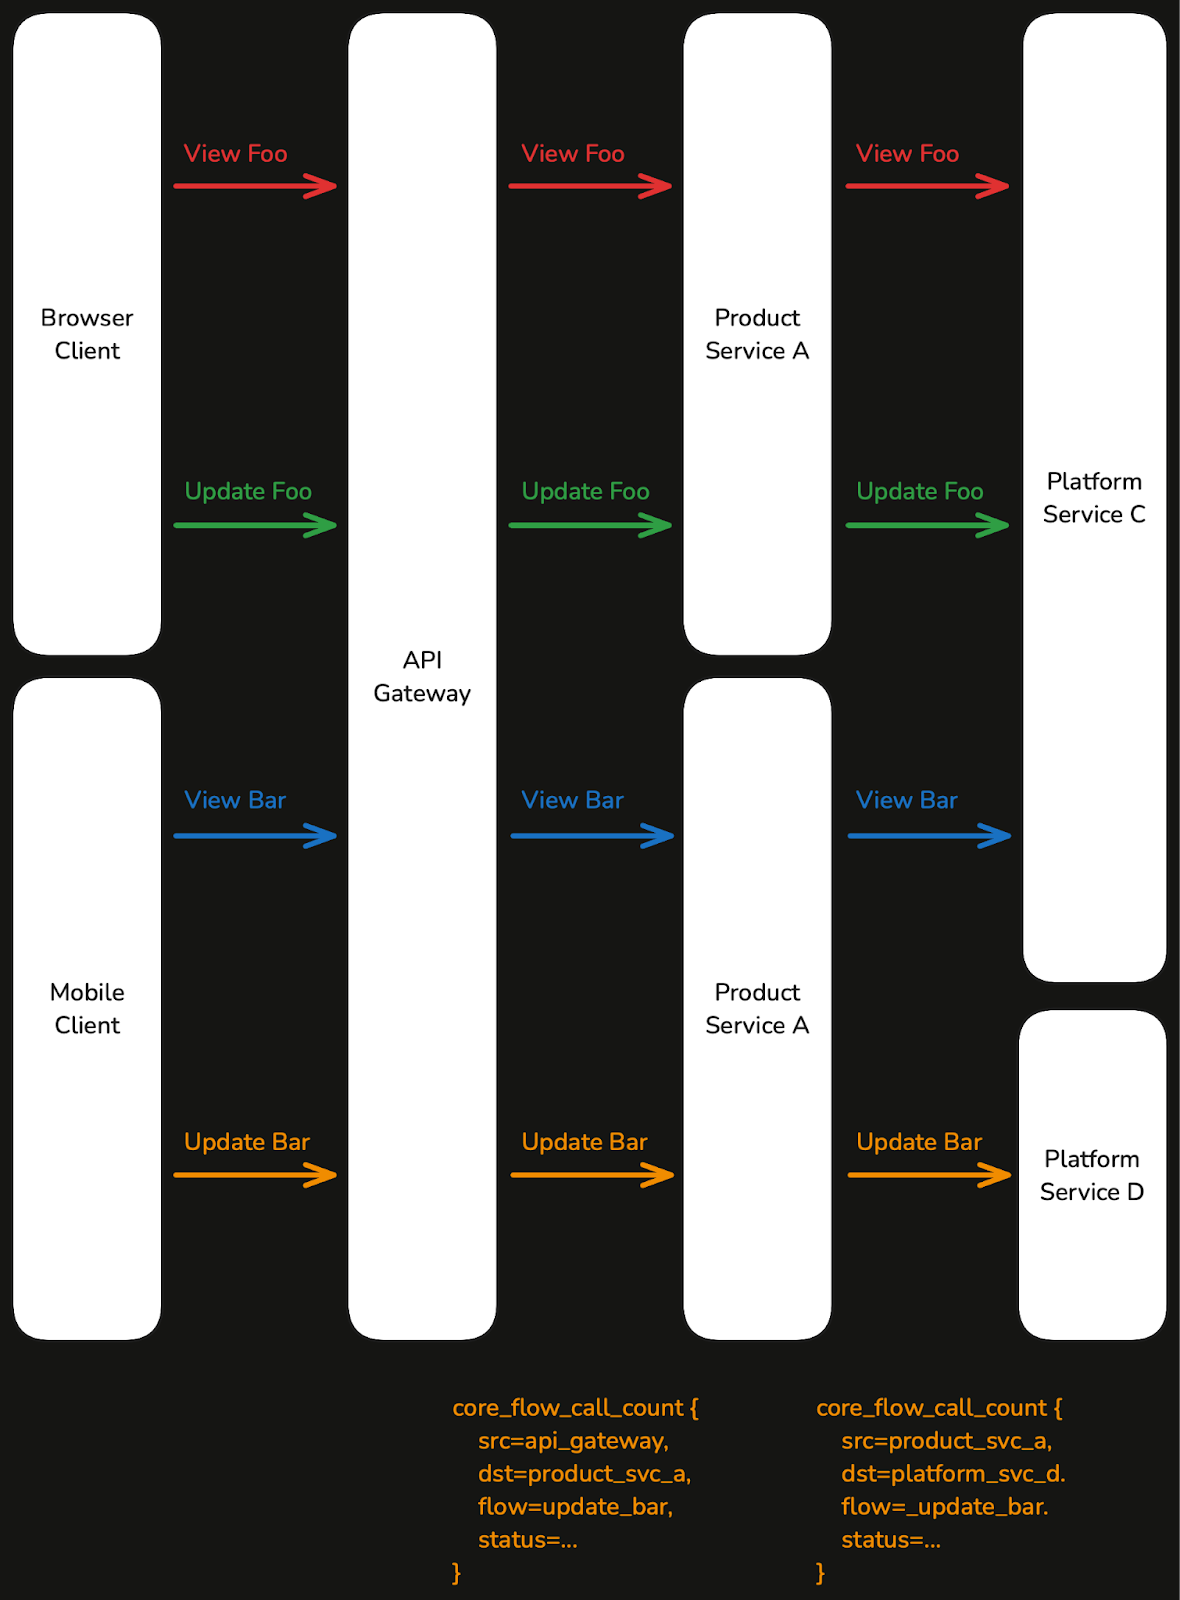
At deployment time, we compare regressions in end to end flows alongside service-specific metrics, helping us catch user-impacting outages.
💡 Takeaway: Monitoring end-to-end business operations provides a comprehensive view that safeguards against subtle yet critical issues that are not visible in service-level metrics alone.
Statistical analysis algorithm
Originally we used the Mann-Whitney U test as the single metric evaluation strategy. Later on, we did a collaboration with our data scientists to introduce the Proportional Check algorithm, which uses Fisher’s exact test under the hood. For our use-case it performs much better on small data sets and can provide meaningful insight quicker. Also, it is a more easily understood option for all checks which work on proportions (e.g. % of failure vs. total request count).
Rollback Criteria
The initial version of our canary mechanism would roll back a deployment if any metrics check failed, erring on the side of caution. However, flaky metrics led to many unnecessary rollbacks, much to our engineers’ frustration.
To better understand our canary deployments, we instrumented:
True positive, false positive, and false negative rates — these correspond to deployments rolled back due to real bugs, deployments rolled back unnecessarily, and deployments that slipped through despite real bugs. Some randomly picked releases are labelled manually, and the rest is done by a LLM-backed classification to validate the performance and its change over time.
Time spent in analysis in each of the above scenarios.
Our aim is to drive up true positive rates, drive down false positive and false negative rates, while minimizing analysis time (good deployments should not drag out, bad deployments should be rolled back ASAP).
Over time, we refined our default checks to optimize and above performance metrics. We also made significant investments towards our user interface.
This UI displays failing checks per release:
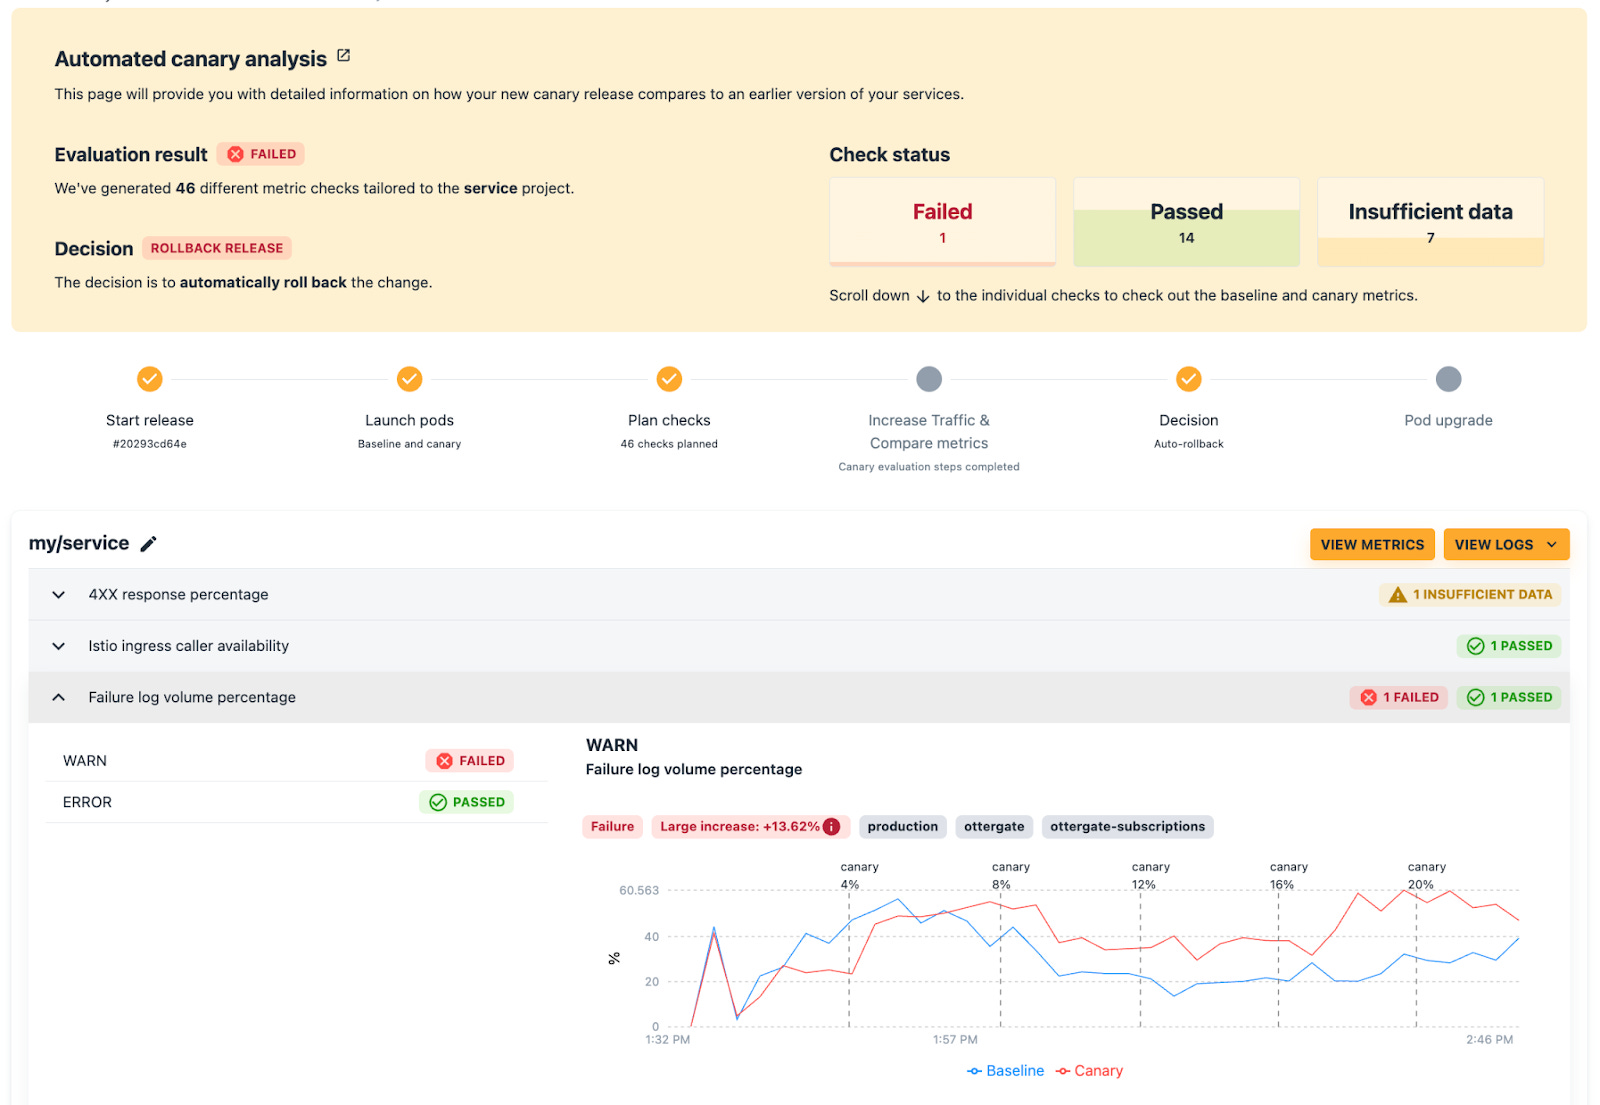
And it empowers users to make further adjustments on their own:
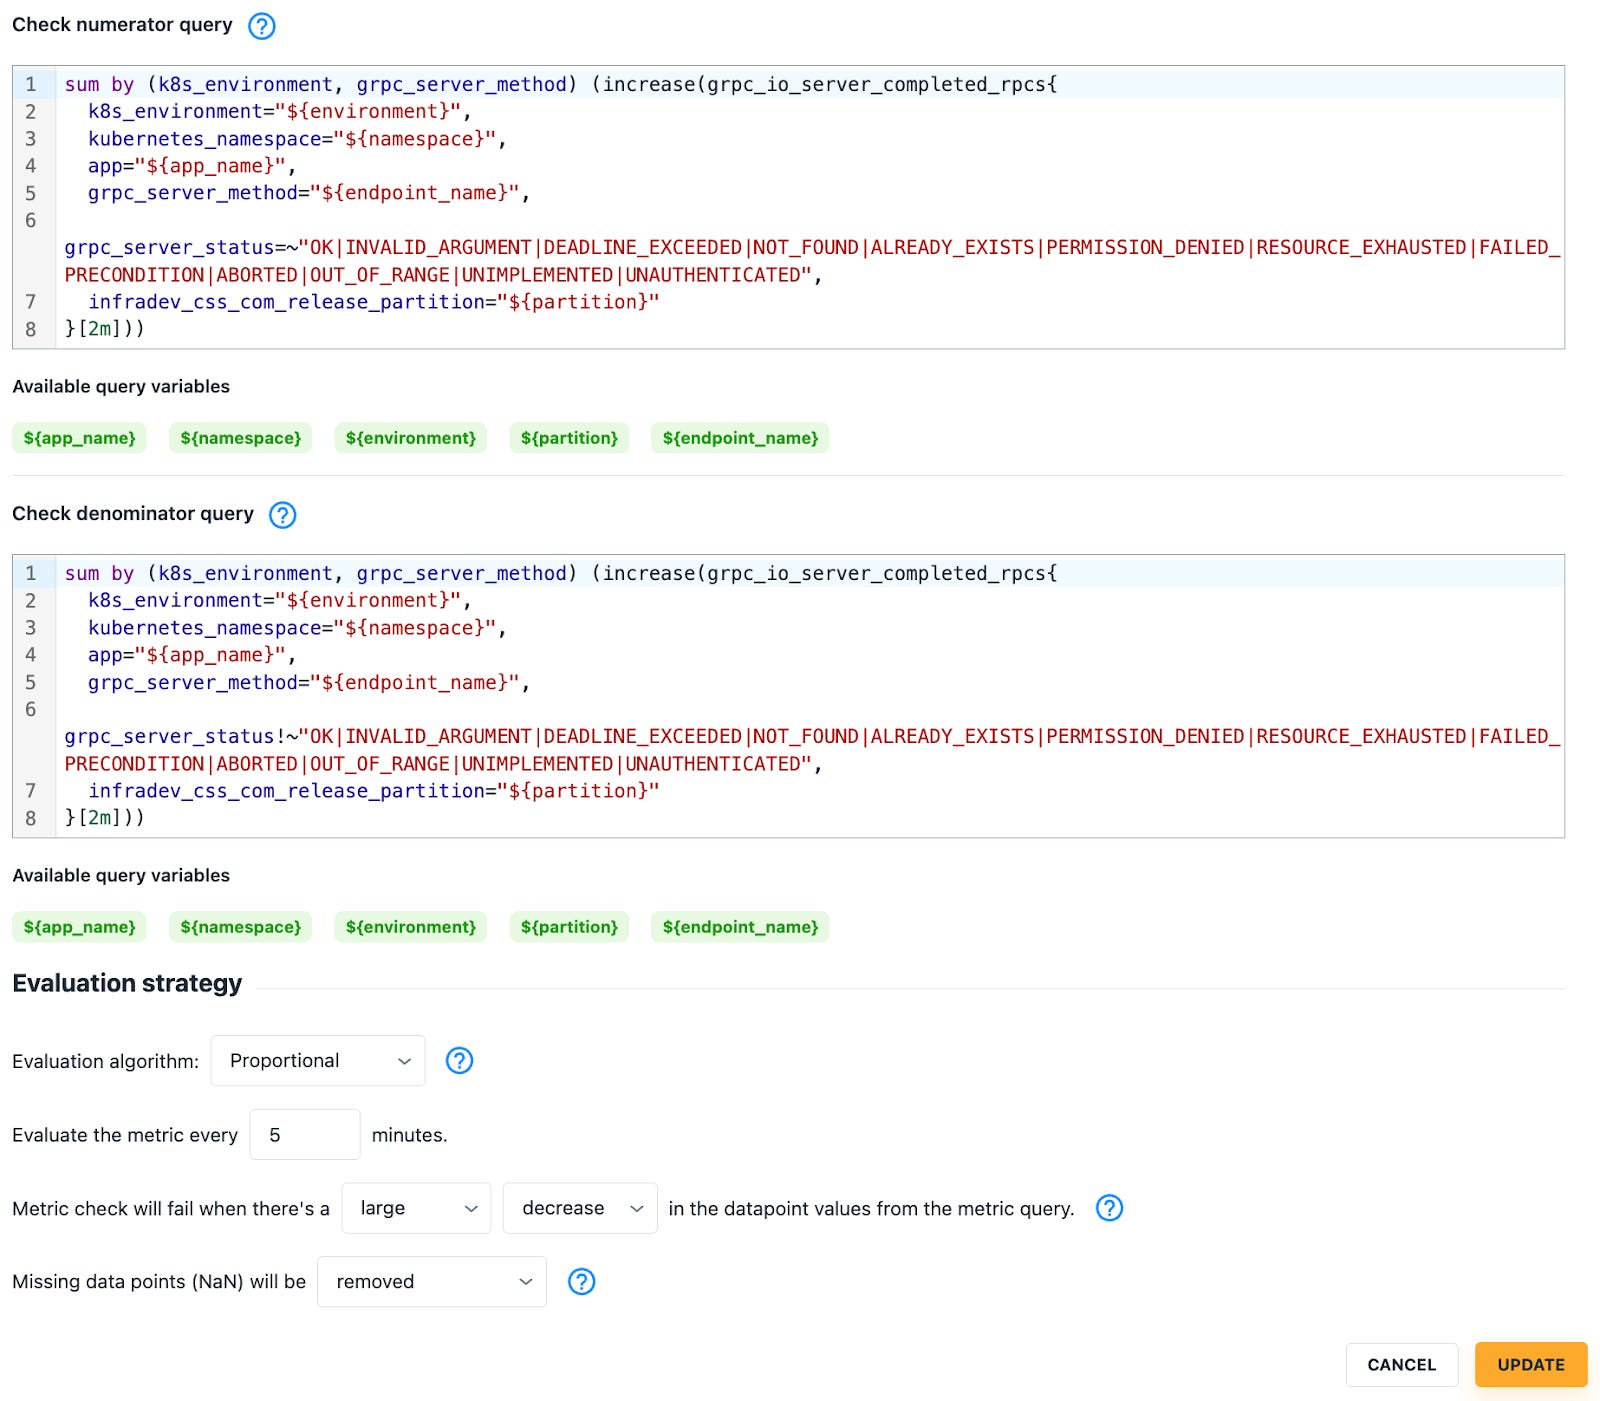
As we introduced new classes of metrics checks (e.g. error log volumes), and as users fine-tuned thresholds, it became necessary to differentiate between metrics checks that were mature from those still in early development.
Ultimately, we categorized them into:
Critical: Immediate rollback upon failure to minimize impact.
Warn: Pages the responsible engineer. They can then flag whether this is a real issue (prompting an immediate rollback). Well-performing checks are promoted into “Critical”.
Debug: The check is logged (metrics collected), but no action is taken. We compare these after-the-fact to know how to modify them; or to promote them into “Warn”.
By granting users both visibility over failing checks and ultimate control if the default rollback parameters were, we drove user trust and wider adoption. At this point, nearly three-quarters of all service deployments across our company are guarded by canary.
Still to do: Implementing backtesting capabilities using historical data to experiment with new parameters without initiating real deployments.
💡 Takeaways:
Invest in instrumentation upfront. To know where to adjust rollback criteria, it is vital to first track true positives, false positives, false negatives, and analysis time on a per metric-basis.
Tiering enables iteration by distinguishing mature checks from those needing far more refinement before they can override a deployment.
Canary requires a great UI. This enables engineers to gain visibility on why the system made any given decision, and is a springboard for them to make adjustments for their own services. This garners trust and adoption.
Conclusion
At this stage, we are far more confident in our ability to deploy new service code while minimizing adverse impact on our customers. There is still room for improvement. For example, we’re currently building more sophisticated rollout cohorts and tweaking AI techniques to further tune false positives and negatives.