

Our journey to affordable logging
The architecture of our in-house Rust based logging engine

Written by Gaurav Nolkha and Tomek Sroka
When Otter first started to hyperscale, the cost of our logging stack grew out of control. Stackdriver (logging platform on GCP we used at the time) consumed 17% of our monthly cloud bill, growing 19% month-over-month. To mitigate without giving up observability we switched to self-managed OpenSearch, cutting costs by 80% but still paid way too much: $3.35 per 100GiB per month and spent significant time on cluster operations.
Even with a dedicated team optimizing OpenSearch, our clusters frequently degraded and our engineers started to lose trust in the observability platform. We were forced to eventually declare a code yellow and spent several months hardening the infrastructure, which was still expensive to run. We needed something radically different. Leveraging blob stores to provide reliable, scalable, cheap storage, we built LogProc: a logging engine optimized for low operational overhead and cost.
The results: LogProc now handles 750+ TiB of logs at 4.4x lower cost than self-hosted OpenSearch, with low operational overhead. We’re 50x cheaper than managed alternatives (like Elastic Cloud), and 70% of our engineers use it daily.
Scaling Pains: Our Journey and Hurdles with OpenSearch
OpenSearch offered powerful search capabilities, but at our scale, costs ballooned, making it one of our top 5 most expensive services.
The real killer was operational overhead. OpenSearch demanded specialized expertise just to stay running. We implemented a hot-cold architecture: SSDs for recent data, cheaper storage for archives, which reduced costs but added operational complexity and failure modes. Our team burned countless hours on cluster maintenance, index tuning, and firefighting. And we were losing.
We eventually realized that OpenSearch’s unit cost wouldn’t scale with our growth. We needed a cheaper, simpler, and more reliable alternative. Most of our challenges stemmed from managing our own storage, so we turned to blob storage, the de facto standard for large-scale data infrastructure. This became the foundation for our new logging engine.
LogProc - A New Logs Datastore
LogProc’s design centers on five core design decisions that directly address OpenSearch’s cost, reliability, and performance deficiencies.
Cost Efficiency with Scalable Storage: With 70% of our costs in storage, we moved to blob storage (Azure Blob) for sizable cost reduction. Unlike OpenSearch’s requirement for replicas, blob storage provides built-in durability, eliminating the overhead of managing redundant data copies (replicas). The trade-off: accessing blob storage is two orders of magnitude slower than fetching data from SSDs, so we must manage query performance through parallel processing and smart caching strategies. This works because most logs are written once but rarely read.
Simplified Reliability with Stateless Query Service: Logging must work when everything else is broken. We built a stateless query engine that requires zero coordination with sub-second startup times; unlike OpenSearch’s complex shard management, our nodes deploy independently. The trade-off: parallelizing and distributing queries requires thoughtful design, for example, using rendezvous hashing to maintain a high cache hit rate.
Horizontal Scalability: LogProc scales seamlessly for both ingestion and querying by simply adding more nodes, without requiring rebalancing. No manual tuning required. With OpenSearch, adding nodes triggered massive shard rebalancing with enormous east-west traffic (intra-cluster data transfer during rebalancing), while removing nodes was a manual, hours-long operation to safely drain shards before scaling down.
Effective Durability: For durability, we use RocksDB for high-performance local buffering before writing to blob storage, reducing the number of blob API calls (and creating fewer but larger blob objects) through batching. The trade-off: queries spanning the last ~15 minutes depend on the ingester; if an ingester node is down, results may be incomplete until it recovers.
Choosing Rust for Performance and Safety: Rust delivers the performance and safety critical for data-intensive workloads. Despite the learning curve, our cluster now consumes ~10x fewer resources (CPU and memory) than OpenSearch, which suffered from Java’s GC pauses and memory bloat.
The result: cheap object storage, minimal indexing, and Rust’s efficiency created the most cost-effective logging solution we could build. Today, 70% of our engineers use LogProc daily via a custom Grafana plugin.
Putting it All Together: LogProc Architecture
LogProc’s architecture separates concerns into two independent paths: a stateful ingestion pipeline that batches logs into blob storage, and a stateless query engine that retrieves them on demand.
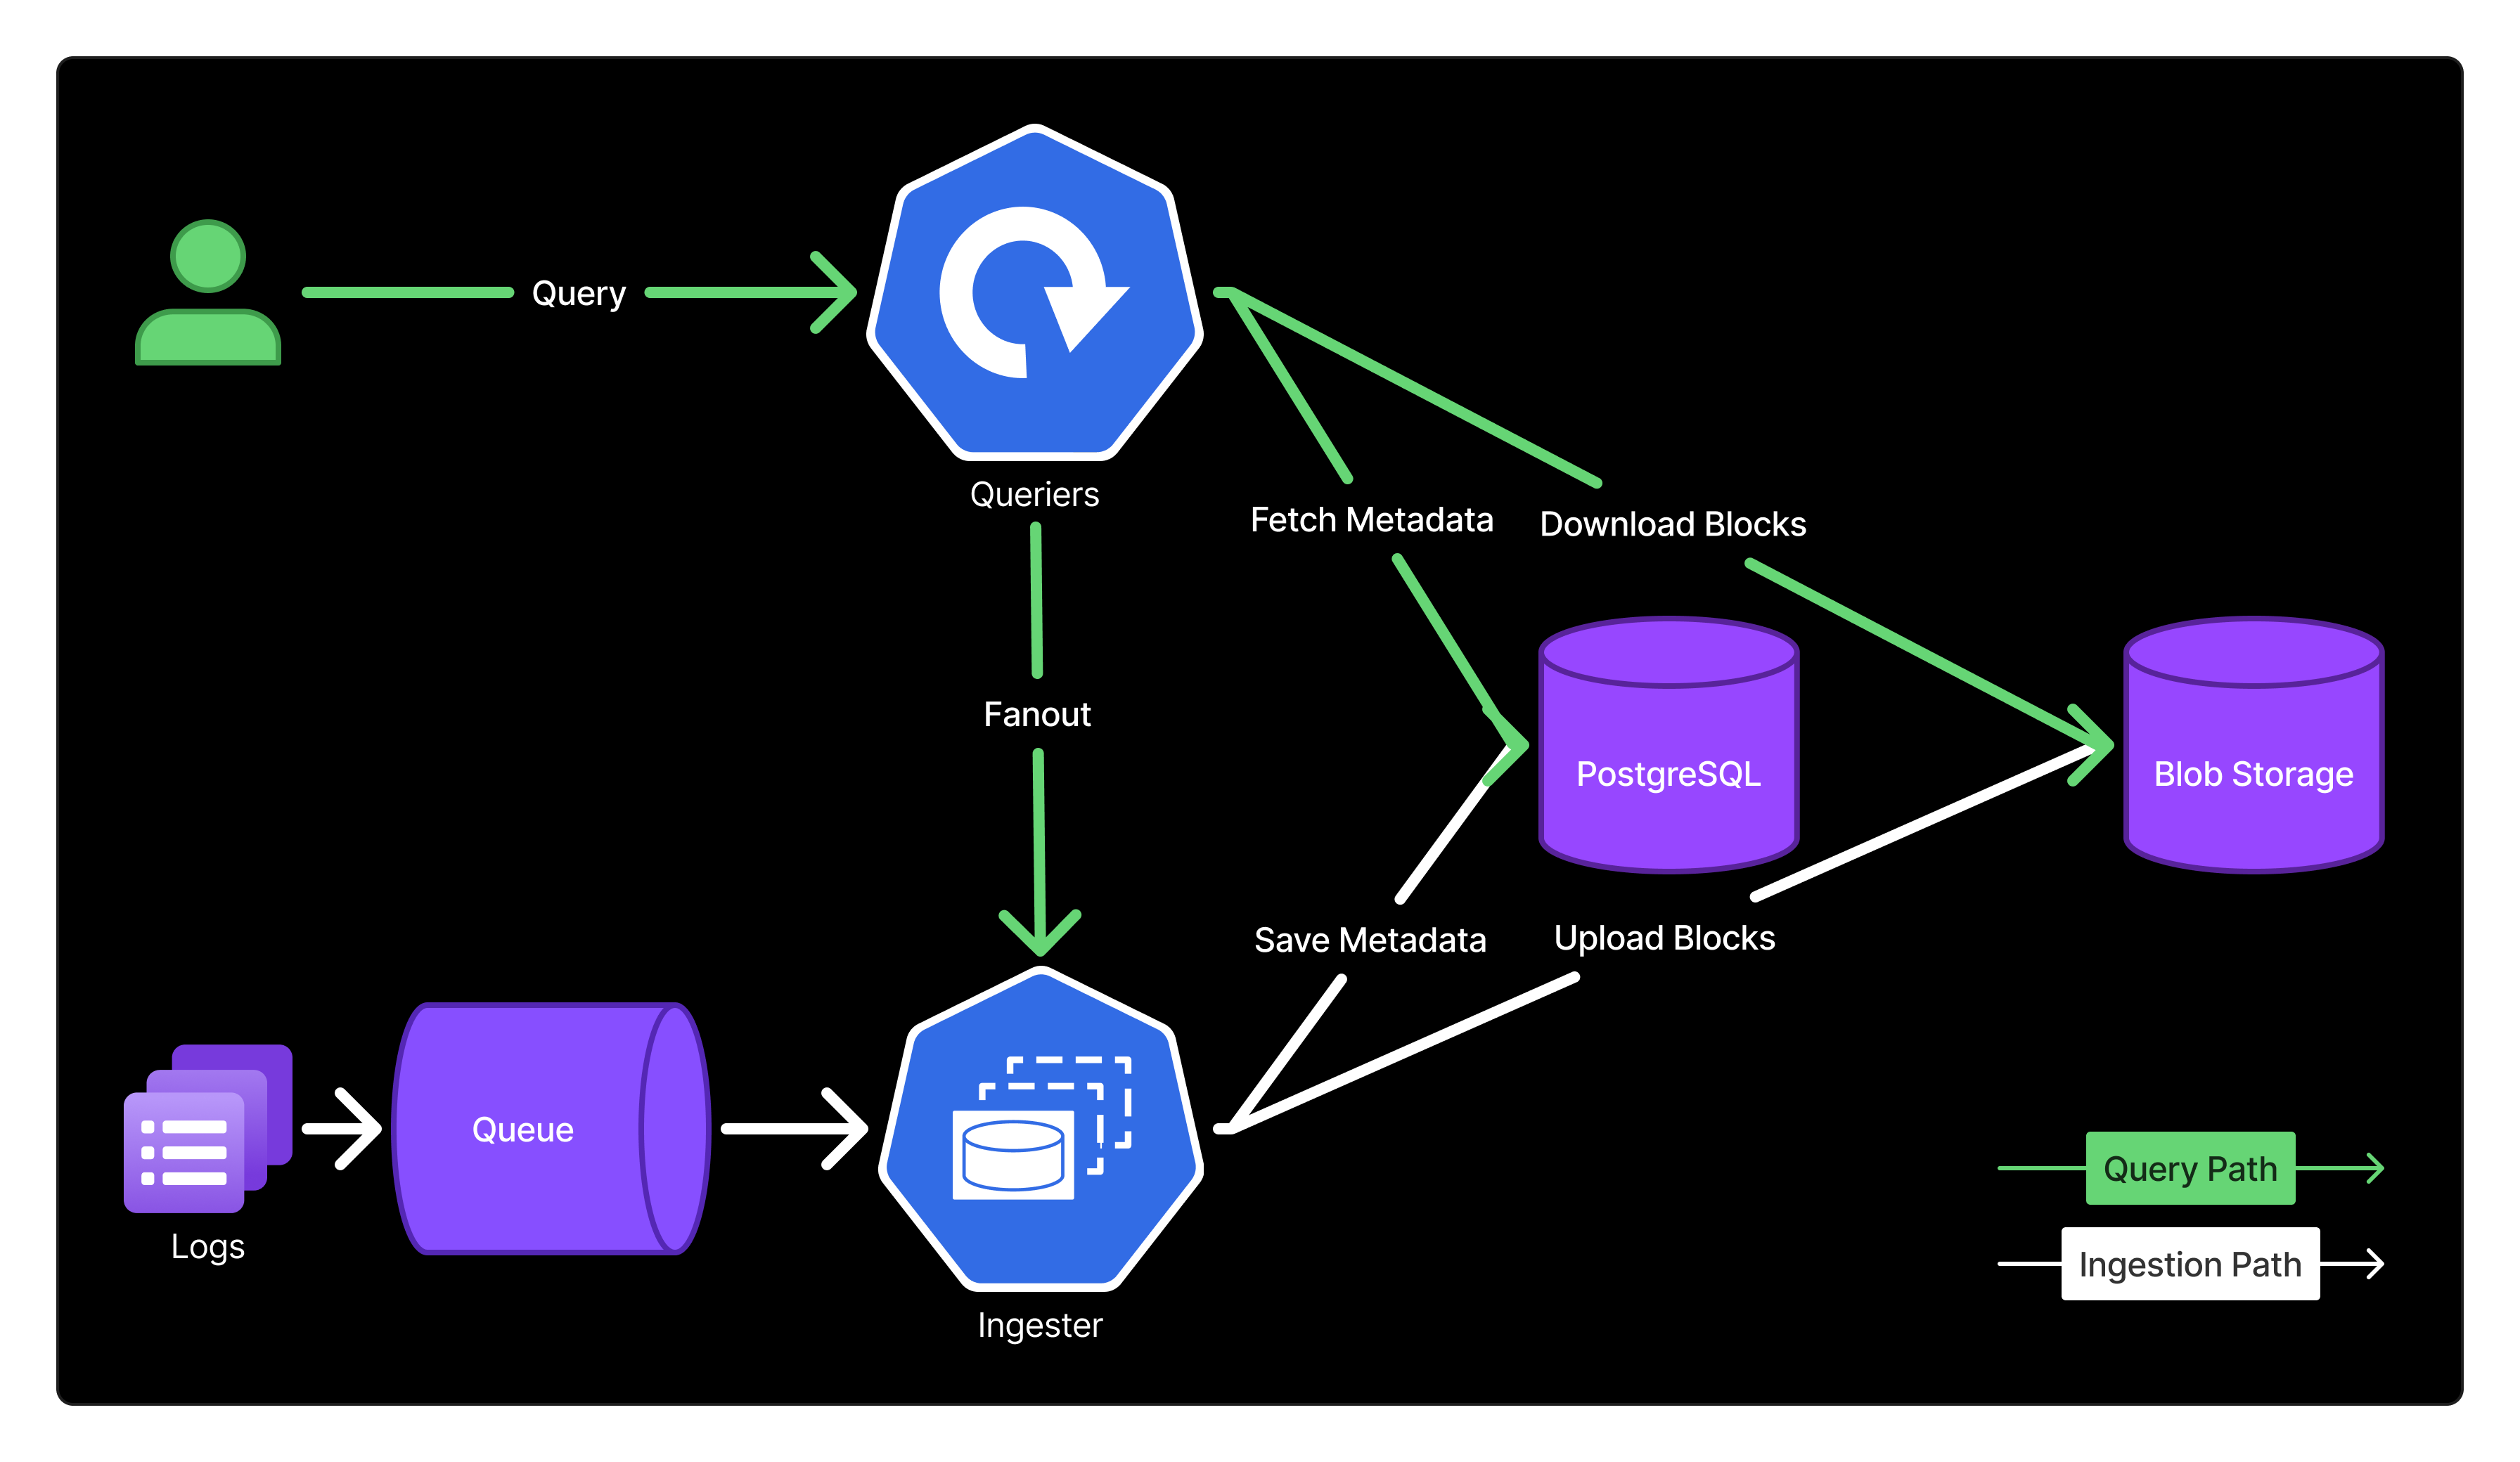
Fig 1: LogProc architecture showing the ingestion pipeline (red), query path (green)
Before diving into how these components work, let’s establish the key concepts:
Logstream: A logical grouping of logs from the same source, identified by region, namespace, app, and container (e.g., region=centralus, namespace=orders, app=order-central, container=oc). Think of it as a labeled bucket for related logs.
Block: A unit of logs from a single logstream (up to 500MiB), uploaded to blob storage. Logs within a block are sorted by timestamp.
Chunk: A ~1MiB subdivision within a block that enables partial downloads during queries. Chunks cover non-overlapping time ranges.
Ingester: Stateful component that batches incoming logs using RocksDB, then uploads blocks to blob storage. Uses High Random Weight, a.k.a. Rendezvous hashing (HRW), a hashing variant that minimizes remaps, to distribute logstreams across instances.
Querier: Stateless component that processes queries by fetching blocks from blob storage (or cache) and merging results. Also queries Ingesters for the most recent logs.
Note on scope: This post focuses on LogProc’s core architecture: ingestion and querying. We’ve omitted two components: the Compactor (background process for merging blocks and enforcing retention) and our Grafana plugin (query interface) for brevity.
Writing Logs
The ingestion pipeline balances two competing goals: minimizing storage costs while enabling fast queries. How we partition, batch, and index logs during writes directly determines query performance. The implication is that there’s no separating storage decisions from query performance optimization.
Partitioning Strategy: Drastically Reducing Search Space
Logs are partitioned into logstreams based on source identifiers: region, namespace, app, and container. This is a fundamental improvement over our OpenSearch setup, which was partitioned only by time.
While OpenSearch’s inverted indexes made field-based searches efficient, time-only partitioning created severe hotspots. Recent shards received the vast majority of queries since users overwhelmingly search recent logs. This concentrated query load on a few indexes degraded performance for everyone, regardless of cluster capacity.
The solution: By partitioning on the app label, we can dramatically narrow the search space. When users specify app and namespace (which we encourage in the UI), we only scan logstreams matching those labels. Instead of searching through terabytes of logs from all services, we search only the relevant logstreams, reducing the data volume 10-100x (proportional to the number of applications).
Ingester Sharding: Sticky Logstreams for Efficiency
Getting logstreams to the right Ingesters is critical for efficiency. We use sticky logstreams, ensuring logs from the same logstream go to the same Ingester. Although if a chosen Ingester fails to accept entries, the receiving Ingester stores them locally as a fallback, ensuring no data loss.
When an Ingester receives a batch of log entries from any source, it groups them by logstream and uses Rendezvous hashing to determine which Ingester should handle each logstream. It then forwards entries to the appropriate Ingesters via internal gRPC calls. Each Ingester maintains a live list of all active Ingesters in the cluster through service discovery.
Why Rendezvous hashing? Unlike simple hash-mod approaches that remap nearly all logstreams when scaling, Rendezvous hashing minimizes disruption: only L/N logstreams need remapping when adding or removing an Ingester (where L = number of logstreams, N = number of Ingesters).
Ensuring logs from the same logstream always go to the same Ingester, enables:
Builds denser blocks for better compression and fewer blob storage PUT API calls.
Avoids rebalancing storms by adding an ingester that remaps ≈L/N streams.
Simplifies failure: if an ingester is down, senders temporarily buffer or retry; once it is back up, it resumes from the local state.
Batching and Block Structure: Enabling Partial Downloads
Each Ingester handles logs from multiple logstreams simultaneously. For each logstream, it accumulates logs in RocksDB (local persistent storage) until one of two conditions is met:
The size threshold is greater than 500MiB of logs accumulated for that logstream.
Time threshold is greater than 15 minutes elapsed since the first log in that logstream.
Why batching matters for cost: Blob storage charges per PUT API call. Writing individual log lines would generate millions of expensive API calls per day. By batching into 500MiB blocks, we reduce API calls by orders of magnitude: a single PUT operation replaces tens of thousands of individual writes.
Once triggered, the Ingester creates a block for that specific logstream containing logs organized into ~1MiB chunks. Each chunk covers a non-overlapping time range and logs are chronologically sorted within chunks.
Why chunks matter for queries: When a query targets a specific time range (or uses our full text search index), the query engine can download only relevant chunks instead of the entire block. This dramatically reduces data transfer and speeds up queries.
Each block and its indexes are uploaded to blob storage, and metadata (logstream identifier, time range, block id) is stored in PostgreSQL. This means an Ingester is continuously creating and uploading blocks for different logstreams as they hit their respective thresholds.
The durability trade-off: RocksDB on persistent volumes acts as a write-ahead log (WAL), ensuring logs are durable even before blob upload. However, the most recent logs (last 15 minutes) haven’t reached blob storage yet and only exist on Ingesters.
For queries covering recent time ranges, the query engine must fetch data from both blob storage and active Ingesters. Since we don’t run Ingester replicas, if an Ingester pod goes down, real-time queries will return incomplete results for that pod’s logstreams until it recovers. When the pod restarts, RocksDB recovers the buffered logs and resumes uploading to blob storage.
In practice, this hasn’t been a concern: Ingester nodes have been stable, and temporary query incompleteness during node restarts is acceptable for our use case. If needed, we could add HA capabilities, but the current trade-off keeps operational complexity minimal.
Index Creation: Filtering Before Scanning
During block creation, the Ingester builds several indexes that allow the query engine to skip irrelevant blocks entirely:
Field Path Index: XOR filter, a compact probabilistic membership filter (similar to Bloom) for “might contain” tests, stores all field paths present in the block (e.g., payload.fields.operation). If a query searches for a field that doesn’t exist in the block, we skip it without downloading.
ID Index: An XOR-based filter, similar to a Field Path Index, helps determine if a specific block might contain a searched value. This filter uses values extracted from log entries via predefined regular expressions. It significantly accelerates “needle in a haystack” queries, such as searching for UUIDs or trace IDs, where the desired value is expected in very few locations.
Free Text Index: FST (Finite State Transducer: automaton for fast token/prefix matching) stores tokenized log content. Enables fast free-text searches by identifying which chunks within a block contain the search terms. Tokens are grouped into 2-token windows (e.g., “order not found” becomes “order not” + “not found”) to improve multi-word search accuracy.
These indexes answer the question: “Does this block contain relevant data?” before we spend time and bandwidth downloading it.
Why This Beats OpenSearch
OpenSearch also used size/time-based batching, but has critical differences with LogProc:
Replica overhead eliminated: Blob storage provides built-in durability. OpenSearch requires storing replicas of both data AND maintaining replica compute nodes: doubling storage costs and compute overhead.
Decoupled storage and compute: Our Ingesters are purely computational; they buffer and batch, but don’t store data long-term. OpenSearch nodes were tightly coupled; losing a node meant both losing compute capacity and triggering complex shard rebalancing.
Simpler failure handling: When an Ingester fails, Rendezvous hashing routes logstreams to other instances with minimal remapping. No shard rebalancing, no replica promotion, no cluster coordination. OpenSearch’s shard allocation and replica management under load often led to degraded cluster states.
The result: we achieve efficient batching and fast queries without the operational complexity and cost overhead of maintaining a replicated cluster. In our largest cluster we have about 9000 logstreams, batching results in ~1 PUT API call every 15 minutes for each logstream and indexes help us filter out ~95% blocks on average.
Querying Logs
The query engine leverages the partitioning, chunking, and indexing decisions made during ingestion to minimize data transfer and maximize cache effectiveness.
Query Flow
When a user submits a query (e.g., “show me errors from app=orders in the last 24 hours”):
1. Metadata Lookup: The lead Querier queries PostgreSQL to identify relevant blocks based on:
Logstream filters (app, namespace, region, container)
Time range
Returns block metadata (location, time range, block ID)
2. Query Recent Logs: The query fans out to all Ingester pods to fetch logs from the last 15 minutes that haven’t been uploaded to blob storage yet.
3. Work Distribution: Using Rendezvous hashing, the Querier that received the request assigns blocks to other Querier instances for parallel processing. Each block’s hash determines which Querier node will handle it; the same block always routes to the same Querier to maximize cache hit ratio.
4. Block Filtering with Indexes: Before downloading any block, each Querier checks the block’s indexes (stored separately in blob storage):
Field Path Index: Does this block contain the queried fields?
ID Index: Does this block contain the searched ids?
Free Text Index: Which chunks contain the search terms?
Blocks that don’t match are skipped entirely. For matching blocks, only relevant chunks are downloaded.
5. Local Processing: Each Querier:
Downloads assigned chunks from blob storage (or retrieves from local cache)
Scans the chunk data for matching logs
Streams results back to the lead Querier
6. Result Merging: The lead Querier merges time-sorted streams from all worker Queriers and Ingesters, returning the final response to the user.
Caching for Performance
Frequently accessed blocks are cached locally on Querier pods. Rendezvous hashing ensures the same blocks always route to the same Queriers, dramatically improving cache hit rates. This means:
Popular logstreams (actively debugged services) stay hot in cache
Repeated queries return results in milliseconds instead of seconds
Reduced blob storage egress costs
Stateless Design Benefits
Unlike OpenSearch’s stateful query coordinators, our Queriers are completely stateless:
No cluster coordination or leader election needed
Queriers can be added or removed instantly; just scale the deployment
Node failures don’t require recovery; queries simply route elsewhere
No “yellow” state degradation under load
The trade-off: performance depends on cache hit rates. Because LogProc does not build a massive reverse index, it needs to get and consult indexes for each block, download blocks, and scan them for matches. In practice, we’ve seen that indexes filter out ~95% of blocks. In addition, parallelizing work and caching also significantly reduces query times even for searching across all logstreams. We keep index caches warm for the last 7 days, maintaining an almost 99% cache hit ratio for queries for that period.
The result: simple query engine that achieved better performance compared to our OpenSearch clusters. For our biggest cluster, P50 is ~200ms and P95 is ~6s.
Conclusion
Building LogProc required challenging fundamental assumptions about logging infrastructure. By separating compute from storage and designing around blob storage’s limitations, we achieved both dramatic cost reduction and operational simplicity.
The key architectural decisions that made this possible: app-based partitioning to reduce search space, sticky logstreams to minimize API calls, aggressive batching to optimize blob storage costs, strategic indexing to skip irrelevant data, and stateless query engines for trivial scaling.
Today, LogProc handles 750 TiB of logs at $0.75 per 100GiB; 4.4x cheaper than our self-managed OpenSearch and 50x cheaper than managed alternatives. More importantly, it requires virtually zero operational overhead. No shard rebalancing, no replica management, no cluster coordination, no degraded states.
The trade-off: We lost OpenSearch’s semantic search capabilities. For our use case of debugging production issues, this was acceptable. The cost savings and elimination of operational headaches far outweighed losing a feature we rarely used.
What’s Next: Open Source LogProc
We’re preparing to open source LogProc in the coming months. As we finalize licensing, packaging, and documentation, we’d love your input, particularly from teams running 100+ TiB of logs. Reach out to help shape the release.
Impressive post. Regarding the LogProc cost ($0.75 per 100 GiB), Azure's Cool blob storage cost is $1 per 100 GiB according to its pricing (https://azure.microsoft.com/en-us/pricing/details/storage/blobs/). Do you have to only use Cool and Archive in order to achieve $0.75 per 100 GiB?
Brilliant. Man, having logging eat 17% of your cloud bill and then dealing with degraded OpenSearch clusters, that's gotta sting. But leveraging blob stores for LogProc and getting that 50x cost reduction with reliabilty is seriously impressive stuff.